- Contest Factory
- September 1, 2020
With all the data consumers are bombarded with on a daily basis, making sure your content gets noticed can feel next to impossible. We all know that photos and images are the most effective way of capturing viewers’ attention (humans process visuals 60,000 times faster than text!!), but how do we go about integrating them into our marketing campaigns in a way that is informative and engaging? We’ll show you how you can use infographics and once you create this valuable content, what should you do with it to ensure you get the most use out of it.
According to the Content Marketing Institute, Infographics is one of 6 top media types that B2B marketers are seeking more of. Infographics are highly sharable as each user online tries to curate their own distribution and stories, these are often fun and easy way to jazz up your content creation by sharing valuable information with snippets of data and bold and bright imagery that is easy to interpret.
 The Magic of Infographics
Infographics are images that combine illustrations, photos, graphs, and symbols with short-form text. They are eye-catching snippets that can be used to educate, inspire positive changes, tell your story, and sell your ideas and products. Infographics can also be used as quick reference and how-to content that keeps your brand top-of-mind to your customer. Providing valuable and useful content is just another strategy today to differentiate your brand and provide more gives than asks.
Infographics are successful because they’re quick and easy to absorb. They can take complex subjects and break them down into visually-stimulating, manageable bites of information that stand out in a feed or email.
Infographics are also a great tool for storytelling, which is at the heart of how you connect with your audience…and expandit! In fact, research shows that infographics are the most shared form of content online. Neil Patel is particularly dedicated to infographics after setting out to build traffic with a 52 week plan of releasing infographics bi-weekly, he grew his audience and following to over 1,000,000; he knew he had something here.
Neil’s research shows one popular infographic from Copyblogger, titled, 15 Grammar Goofs generated 60K+ Facebook likes, 6K+ Tweets, 2K+ Linkedin shares, 195K+ pins, and over 500 comments. How’s that for some staying power
Killer Infographics Your Audience Will Love
![]()
Although you don’t have to be a graphic designer, creating the kind of infographics that go viral does take some skill and practice. Fortunately, there are plenty of design sites out there to walk you through the process. Even sites like Canva and PicMonkey have a decent selection of infographics templates.
There is also a good amount of handy infographics to break it down for you…
The best way to start is by searching top-rated infographics and spending time on sites like Visually. Compile a folder with the ones you like best and make a list of the elements they have in common. Note which characteristics stand out to you and why. And most importantly, make sure you choose a design that fits the tone and style of your brand, otherwise, it will fall flat with your audience.
Another important element is statistics. This is often scary to people but it does not need to be. While original research is the most effective way to present interesting information, you may not have any. Don’t fret as you can create original research fairly simply with surveys. You can send your survey to your audience or you can place an ad on social media to your target audience and collect a decent sized sample (over 100) and now your survey software should tally your statistics for you. If you need help selecting survey software, you may check out G2 where business users rate different software platforms. Here is their review on survey software.>>
You want your brand to be relevant and visible in your infographic; you may consider using iconic branding elements through out your infographic. McDonald’s may consider publishing a visual nutrition chart with their iconic characters next to each menu item as well as the actual food. This will act not only as interesting but reinforce their brand and double as an advertisement. Supporting the sale of salads may be a good use by having a salad infographic.
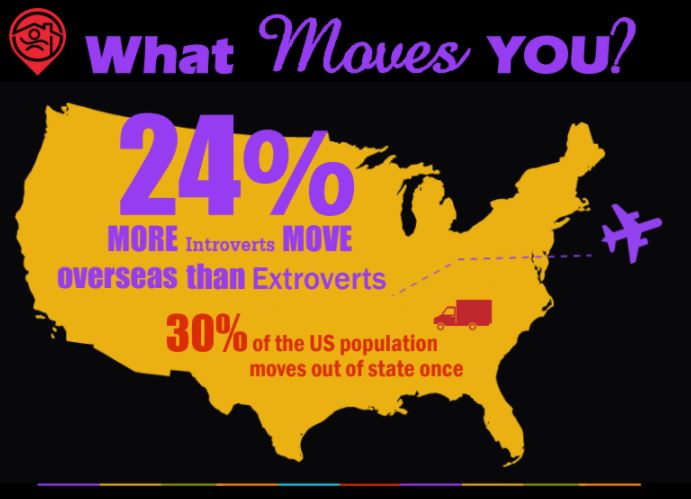
Clear presentation and storytelling is very important. You can see the infographic to the left missed the mark on readability. Be sure your message is clear or you spend a lot of energy that will get little consumption and share. Also note the logo is very camouflaged at the bottom of the infographic. The icons also do not pertain to the brand or unique to the step with a true visual relation to the data being displayed.
Distributing Your Infographic Content
Successful marketing today is all about sharing great content in the most captivating way possible. Infographics are hands down, one of the best ways to do just that. Not only are you creating engaging content to keep your brand top-of-mind, but you are also paving the way for your viewers to sharethe love. And the popular question is always, how do I get this to the right people? Today, more than ever, social media has made it easy to get your content in the right hands.
- Post your infographic on Facebook and tag important influencers (quote influencers and tag them and you have a greater chance of a share). You may also advertise the infographic and target your audience to find new customers and start branding at the top of the funnel with helpful information.
- Post your infographic on Linkedin and tag companies, colleagues, and partners that would find this information valuable; you may consider doing a joint infographic to expand your audience to complimentary groups with similar goals.
- You may consider publishing a press release announcing the new research published via infographic. You can also find local business journalists and relevant vertical niche publications and send them both your press release and infographic as they too are always seeking valuable content to share with the world.
- Both Instagram and Pinterest are very visual networks where you may also share this content.
- Don’t forget your owned assets: Be sure to post this on your website and email your customer base this exciting new research that will make their life better, branded by you.
Before you know it, you’ll be the next infographic gone viral…just like magic.